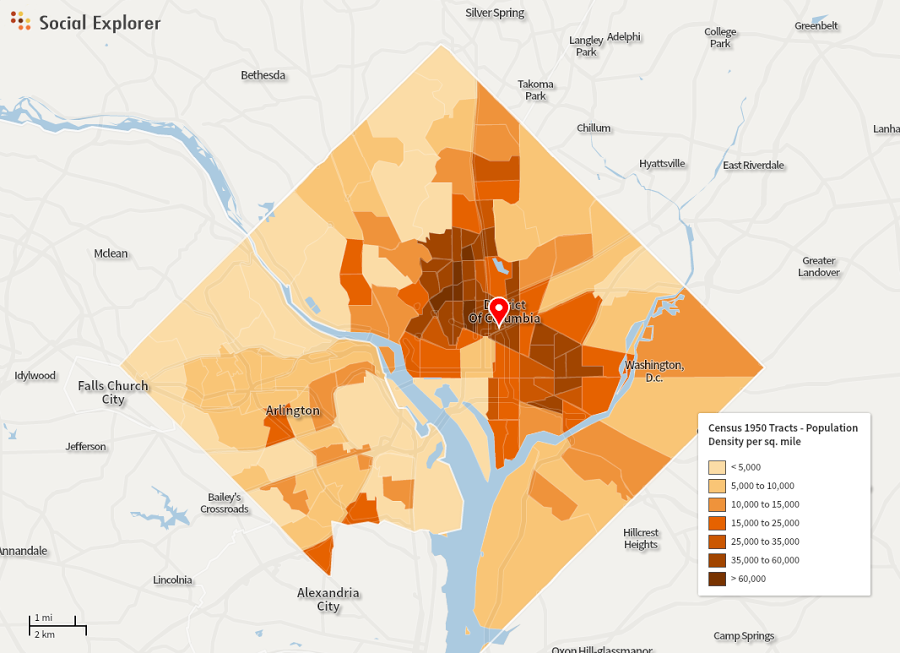
[Figure 1]
|
PopulationPopulations in D.C. neighborhoods grew by almost 50% in recent years. This growth has been accompanied by sprawl. There is lessening growth of density in any one area and instead the expansion of transportation infrastructure and commuters. Over the years of development, homes have been built outside and adjacent to Washington, bringing a creation of more jobs away from the city center. The expansion of the region has diminished concentration in any one area. [1]
|
Demographics
|
Additionally, there is a heightening disparity amongst the northern and southern neighborhoods. Successive gradation can be seen such as in the figure labeled 2.2. Similar looking unemployment and higher education maps reflect their inverse connection. The areas where concentration of wages are the highest and lowest are respective of the geographic location.
To read more about population and demographics click here. |

|
Sources
[1] United States. Washington, D.C. Office of Planning. Comprehensive Plan. Washington, D.C.: n.p., 2013. Planning.dc.gov. Web. 31 Aug. 2015. <http://planning.dc.gov/page/comprehensive-plan>.
Figures
[Figure 1] Social Explorer Density Map. Digital image. N.p., n.d. Web. 31 Aug. 2015. <http://www.city-data.com/forum/washington-dc/2263182-census-estimates-d-c-population-july-3.html>.
[Figure 2.2] Unemployment in 2002. Digital Image. United States. Washington, D.C. Office of Planning. Comprehensive Plan. Vol. 1. Washington, D.C.: n.p., 2013. Planning.dc.gov. Web. 31 Aug. 2015. <http://planning.dc.gov/page/comprehensive-plan>.
